Innovations in Energy: Shaping a Sustainable Future
Introduction
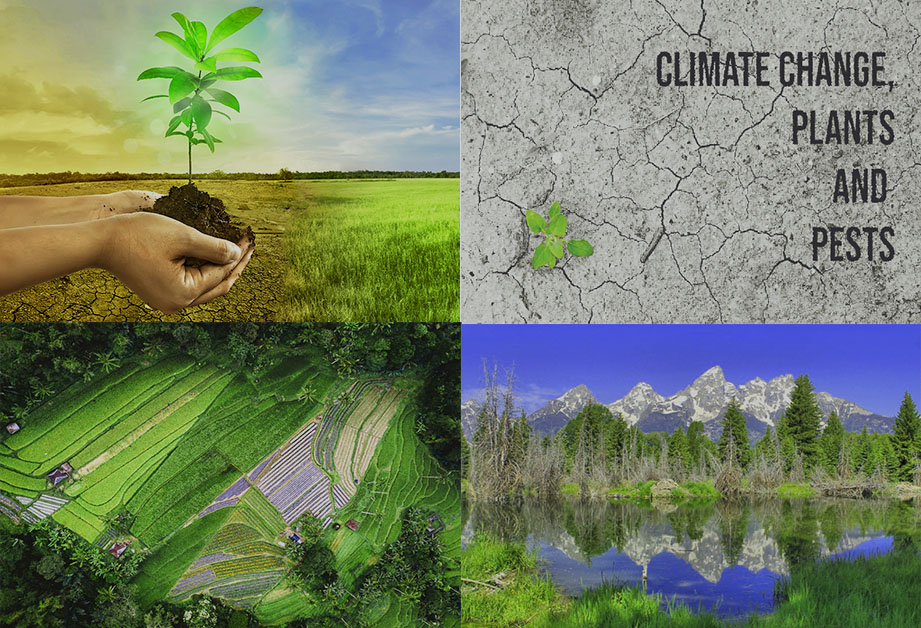
Innovation in the energy sector has emerged as a driving force in shaping a sustainable future for our planet. As the world faces mounting challenges related to climate change, resource depletion, and increasing energy demands, finding new and efficient ways to harness, store, and utilize energy has become crucial. In this comprehensive exploration, we will delve into the key innovations in energy that are revolutionizing the industry and paving the way towards a cleaner, greener, and more sustainable world.
-
Renewable Energy Technologies
One of the most significant advancements in the energy sector is the rapid growth of renewable energy technologies. Solar power, wind energy, hydroelectricity, geothermal energy, and biomass have gained immense traction as viable alternatives to fossil fuels. Solar photovoltaic (PV) technology, in particular, has seen remarkable progress in recent years, with improved efficiency and declining costs making it more accessible than ever before. Wind power has also witnessed substantial innovation, with the development of larger, more efficient turbines capable of harnessing more energy from the wind.
-
Energy Storage Solutions
As renewable energy sources become increasingly prominent, the need for efficient energy storage solutions becomes critical. Innovations in energy storage technologies are unlocking the potential of renewables by enabling better integration with the power grid and ensuring a continuous and reliable energy supply. Advancements in lithium-ion batteries and other emerging technologies like flow batteries and solid-state batteries are extending energy storage capacity, enhancing the stability of power systems, and facilitating the growth of electric vehicles.
-
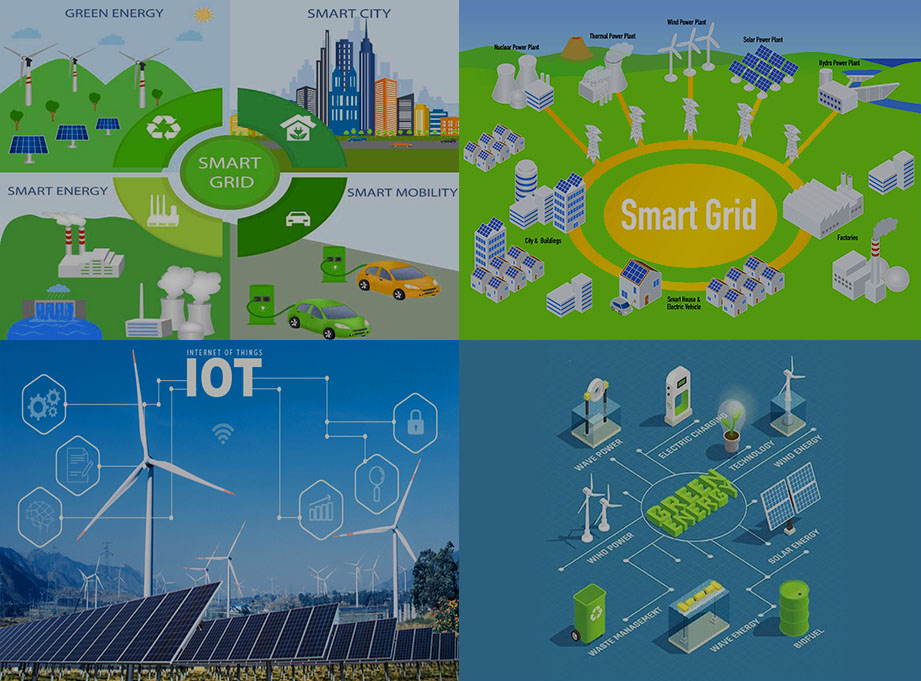
Smart Grid and Grid Modernization
The advent of smart grid technology is transforming the traditional electricity grid into a dynamic and interconnected system. Smart grids use advanced sensors, communication, and control systems to optimize energy distribution, reduce energy wastage, and enhance reliability. Additionally, smart grids enable the integration of distributed energy resources, such as rooftop solar panels and home energy storage, into the grid, promoting decentralized and cleaner energy generation.
-
Internet of Things (IoT) and Energy Management
The Internet of Things (IoT) has revolutionized energy management by enabling real-time data collection and analysis. IoT-connected devices and sensors provide valuable insights into energy consumption patterns, allowing for better energy efficiency strategies. Smart thermostats, intelligent lighting systems, and automated home appliances contribute to reducing energy consumption and empowering consumers to make informed decisions about their energy usage.
-
Green Building Technologies
The construction industry is embracing green building technologies to create energy-efficient and sustainable buildings. Innovations in energy-efficient insulation, windows, lighting, and ventilation systems have substantially reduced energy demand in buildings. Furthermore, the concept of net-zero energy buildings, which produce as much energy as they consume, is gaining momentum, contributing to a more energy-independent future.
-
Electric Vehicles and Transportation
The rise of electric vehicles (EVs) is transforming the transportation sector and reducing its reliance on fossil fuels. Advances in battery technology have led to longer driving ranges and faster charging times, addressing the main concerns of EV adoption. Furthermore, innovations in EV charging infrastructure, such as wireless charging and fast-charging stations, are making EVs more practical and convenient for consumers.
-
Hydrogen and Fuel Cell Technologies
Hydrogen has emerged as a promising clean energy carrier, and fuel cell technologies are gaining attention for various applications. Fuel cells offer a highly efficient and emission-free method of generating electricity, with hydrogen as the primary fuel source. Advancements in hydrogen production, storage, and distribution are paving the way for its broader adoption in industries like transportation, manufacturing, and power generation.
-
Artificial Intelligence (AI) in Energy
Artificial Intelligence (AI) is playing a pivotal role in optimizing energy systems and enhancing energy efficiency. AI-powered predictive analytics and machine learning algorithms are being used to forecast energy demand, optimize energy distribution, and improve energy management. These AI-driven innovations help maximize the utilization of renewable energy sources and minimize waste, contributing to a more sustainable energy landscape.


